Beating light pollution with a new synthetic RGB algorithm
Imaging deep sky objects from a suburban driveway forces one to find ways to deal with light pollution. Light pollution is the enemy of astronomers – but in reality, there are ways around it.
Some of the most beautiful objects in the cosmos are called emission nebula. They are clouds of gas, often where new stars are being born. They give off light only in very specific wavelengths, resulting from their elemental gases being ionized in specific ways.
We can use this to our advantage by imaging through filters that only allow those wavelengths through – and therefore much less of the light pollution. By a happy accident, most light pollution exists at different wavelengths than the colors emission nebulae shine at. Even white LED streetlights are less intense at the wavelengths we’re interested in for these objects.
The problem is how to represent the light gathered through these “narrowband filters” in a visually pleasing way. Most of the Hubble photos you see use what’s called a “SHO mapping” – where the color red represents Sulfur-II emissions, green represents Hydrogen-alpha emissions, and blue represents Oxygen-III emissions. That gives you pretty pictures such as the famous “pillars of creation,” but it’s not a representation of what these objects would really look like to the eye. They are false-color images that have scientific value, and sometimes happen to be really pretty. But usually they just look green, with bloated, magenta stars.
And to the eye, these objects are beautiful in their natural state. Wouldn’t it be great if we could reconstruct a visible-light image from narrowband data? It would be like banishing light pollution from your city, or like having a telescope in the Atacama desert! Well, we can.
Yesterday, I derived a way of mapping narrowband data to RGB (red, green blue) images that uses the spectral characteristics of emission nebulae to reconstruct how they appear in visible light – just given their emissions in Sulfur-II (SII), Hydrogen-alpha (Ha), and Oxygen-III (OIII). People have tried this before; commonly, an “HOO” mapping is used to reflect the fact that Hydrogen emissions are red to the eye, and Oxygen is more or less cyan. Some more advanced imagers have also added some Hydrogen data into the blue channel, knowing that there’s actually a second Hydrogen emission line closer to blue. But few people have gone to the trouble of synthesizing each emission line from a nebula from this data, converting the wavelengths to precise RGB values, and combining them all together. I posted the details of how I derived it all on a forum called Cloudy Nights. But the final result is this:
R = 0.5*Ha + 0.5*SII
G = 0.5*OIII + 0.094*Ha
B = 0.295*OIII + 0.1*Ha
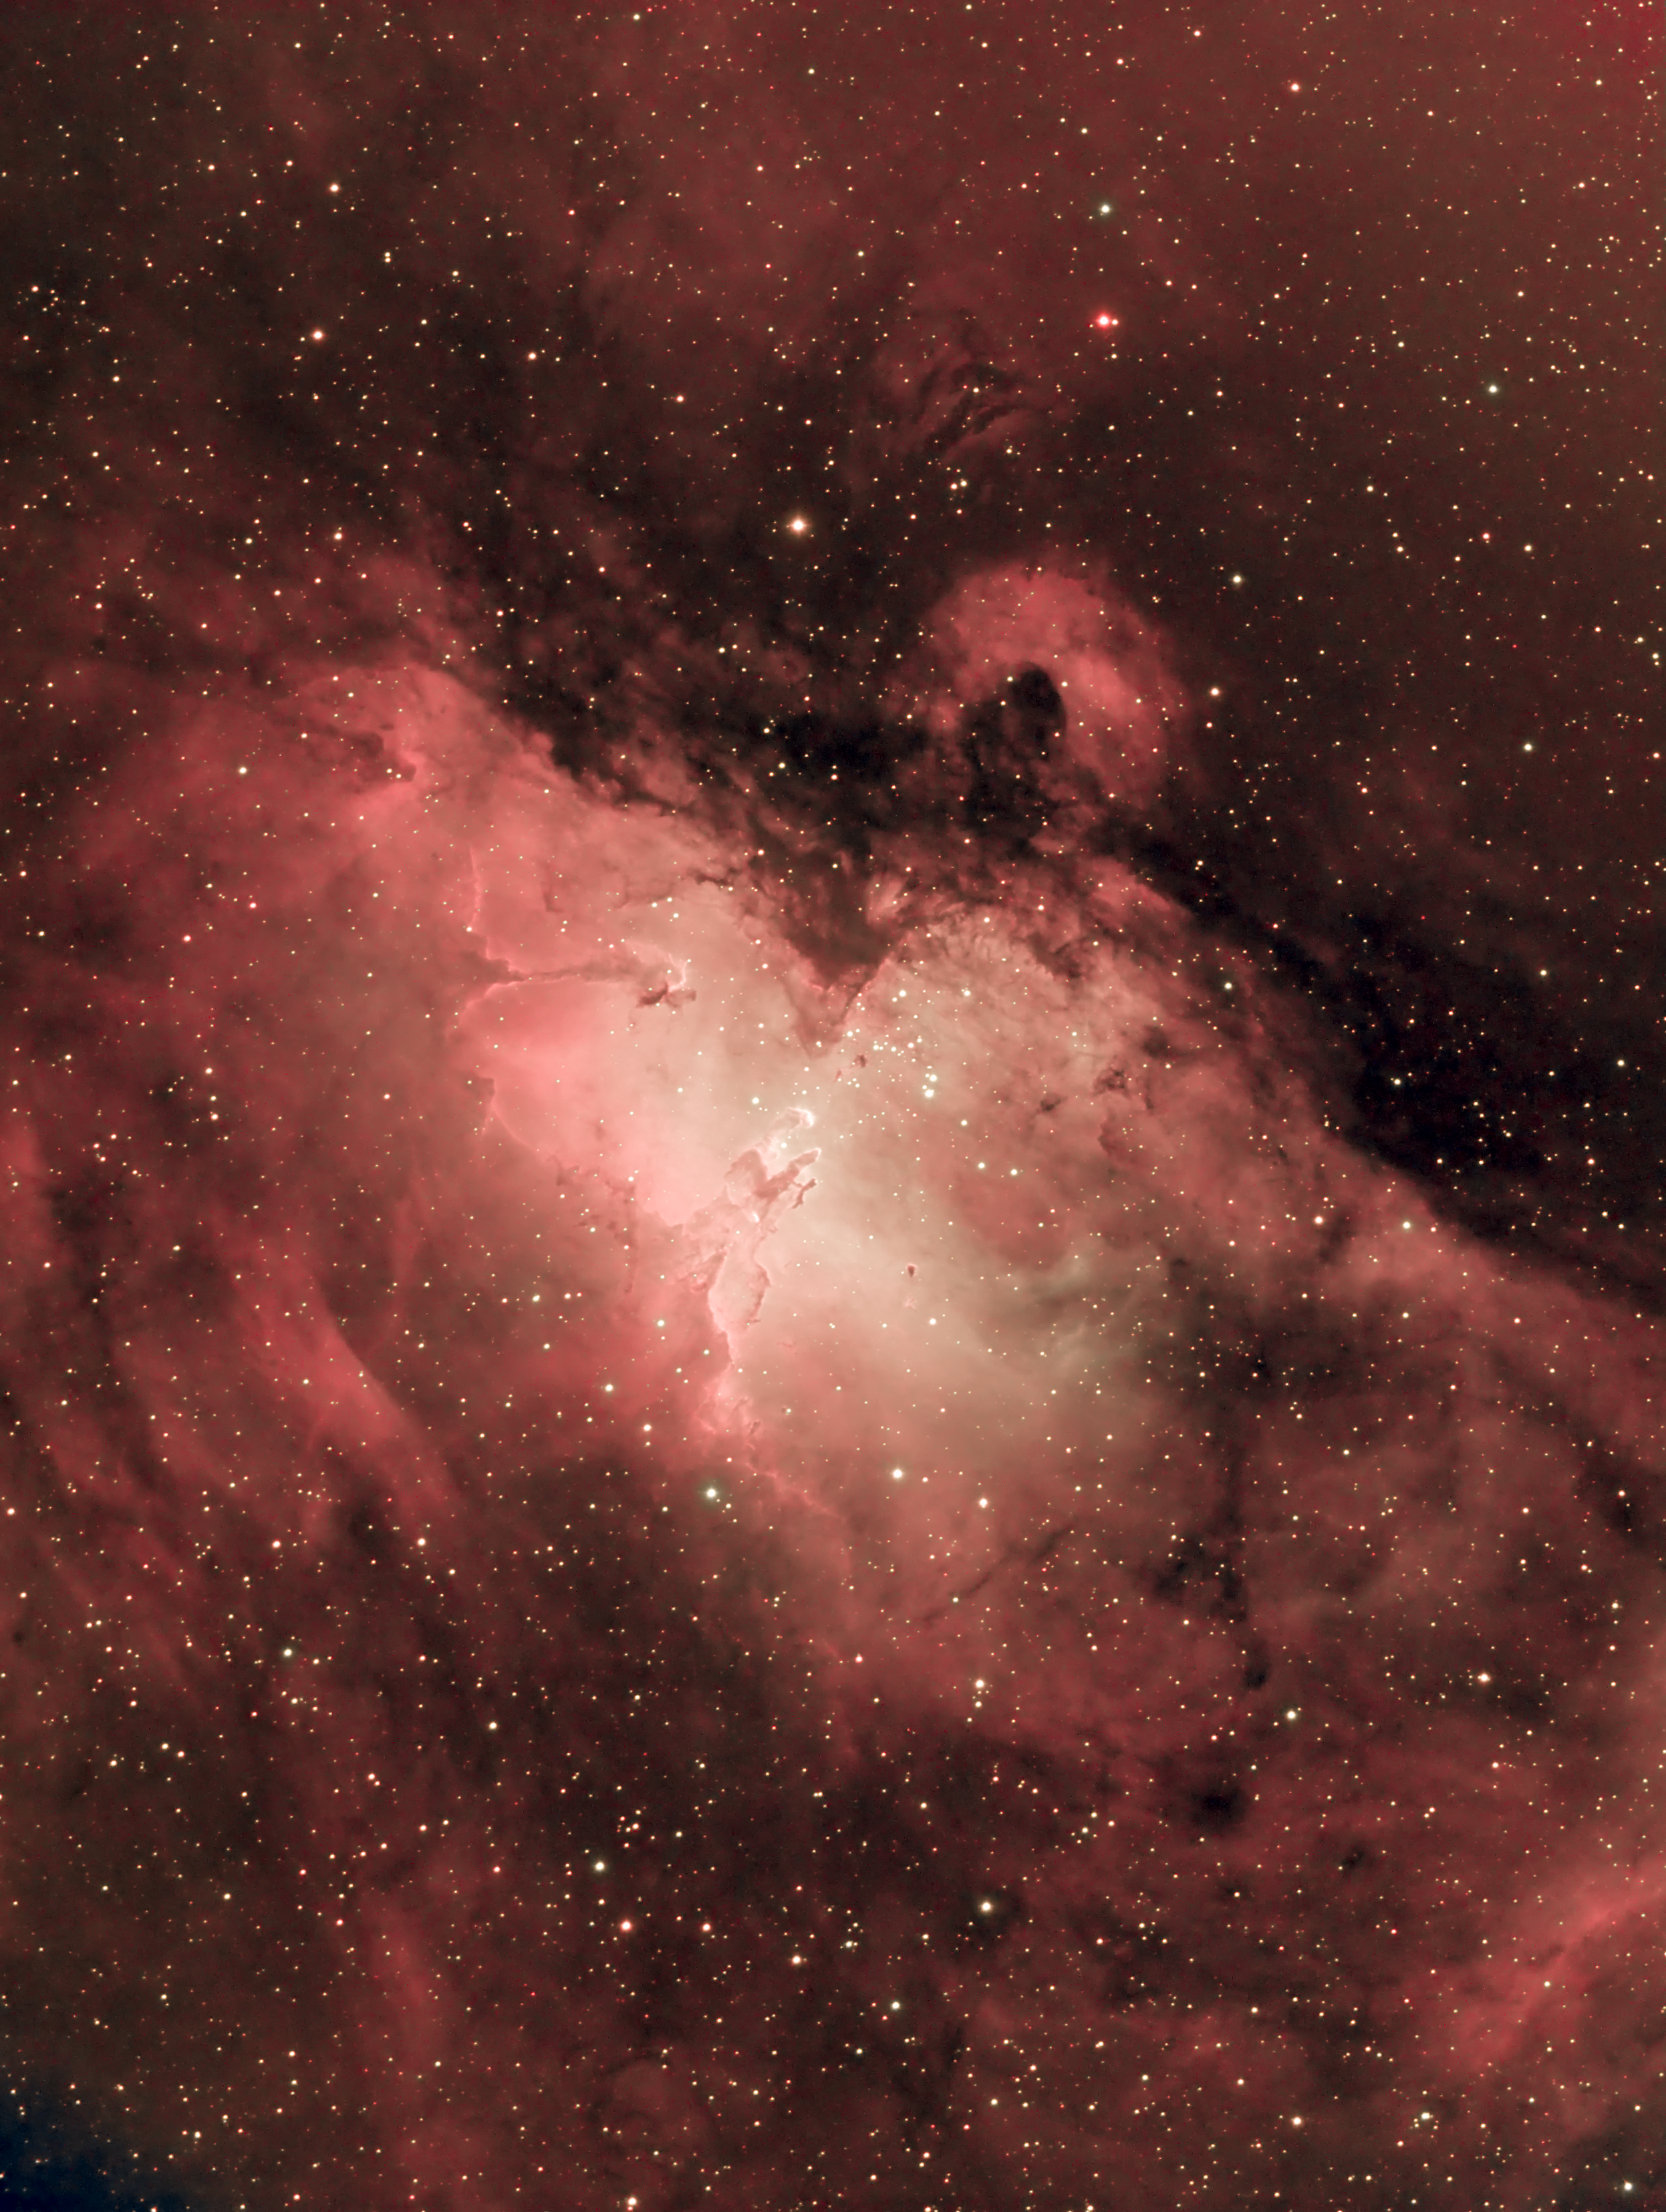
And, here’s my image of the Eagle Nebula created with this formula, taken from my light-polluted driveway, literally underneath a streetlight. Look for the “pillars of creation” in the middle – as they really are!
![]()
This is REALLY EXCITING – at least to me! I’ve compared this to an image taken with a 2.2-meter telescope in the Atacama desert – and although their image appears more red than mine, mine actually has more detail and what I think is more pleasing color palette. If you compare it to a true-color image taken with somewhat comparable equipment, it’s actually a pretty close match. And NO color manipulation in Photoshop was required – this image just fell out of the math naturally. This means processing my images will be a much faster process, and with nothing subjective in how they are produced. While that does take some of the “art” out of the process, the geek in me loves the fact that nature is producing art all on its own.
A guy with a PhD in optical science chimed in on the discussion where I originally posted this, and basically said “yeah, that’s close to how I’ve been doing it too, and my results look like yours.” I’m giddy that someone who understands this stuff better than me arrived at similar results on his own, just working from the physics and math of it all.
And, it makes me want to scream from the mountaintops: astrophotography can be done anywhere! I think a lot of people shy away from this hobby in part because they think they’ll never get good results where they live, and their family commitments prevent them from traveling to dark sky sites. But this image shows that even from an urban driveway, you can create images that rival huge, professional observatories in the Chilean desert. You just have to know the right tricks.
I want to write more about those tricks; every image on this site was taken from my suburban home in a “red zone” on the light pollution map, and every time I feel like I’m winning a battle against light pollution. You’re not limited to emission nebulae in suburbia – planets, the Moon, and even many distant galaxies are attainable if you know how and have the right gear. Sure, at a dark site there are objects you can image that I can’t – and you’ll get a quality image in much less time. I’ll probably never produce an APOD from my driveway, but very satisfying results happen all the time. So much is within reach from your own backyard, and that’s really exciting.
One Comment